
Abstract
Public
health authorities have for many years recommended diets high in
complex carbohydrates for weight loss and prevention of heart
disease. However, the research literature does not uniformly support
the view that a replacement of fats, including saturated fats, with
carbohydrates in the diet necessarily results in beneficial changes
in cholesterol levels or heart disease risk. While very low
carbohydrate diets have sometimes been observed to result in
favorable changes to cardiovascular risk factors (due to the
increases in HDL and decreases in fasting triglycerides often
observed on those diets), there have been reports that, in a subset
of the population, a very low carbohydrate diet may result in large
increases in potentially atherogenic non-HDL cholesterol.
The
reported studies to date have not been designed to investigate what
happens to an individual with high non-HDL cholesterol who
transitions from a long-term very low carbohydrate diet to a very
high carbohydrate, non-vegetarian diet. The present study was
designed to address that question using the author as the sole
subject.
Results:
Transition from a very low carbohydrate diet to a very high
carbohydrate diet resulted in a rapid and dramatic reduction in
non-HDL cholesterol. Improvements were also seen in oxidized
lipoproteins, uric acid, and postprandial fat and carbohydrate
metabolism. Seasonal allergies, which were virtually eliminated
on the very low carbohydrate diet, returned upon adoption of the very
high carbohydrate diet. No other deleterious effects were
observed other than an increase in homocysteine, which was reversed through B-vitamin supplementation, suggesting the diet as
implemented provided inadequate B vitamins. The diet is inexpensive
and sustainable, though long-term effects (beyond 7 months) are not
yet known.
The short version
You
can watch my talk about this experiment at the New York Quantified Self meetup on
Stephen Dean's Vimeo page. Note that this talk was given before I
received my follow-up blood work showing the normalization of my
elevated homocysteine and inflammatory markers.
Introduction
The
present study was designed to measure the effects, primarily on blood
lipids, of a 4-month very high carbohydrate, non-vegetarian dietary
intervention (>65% carbohydrates on average) following several
years of consumption of a very low carbohydrate diet, under
approximately isoenergetic conditions (i.e. the intervention was
adjusted to preserve pre-intervention body weight).
The
study measured HDL and non-HDL cholesterol and a variety of other
biomarkers. Note that, while blood lipids may be considered "risk
factors" for heart disease, changes in these numbers do not
necessarily represent a change in actual risk for heart disease. This
study was not designed to detect changes in actual heart disease
(which I don't have), and therefore I will say no more about actual
heart disease in this write-up.
Conventional wisdom on carbohydrate consumption
Mainstream health authorities
typically recommend a high level of dietary complex carbohydrate
consumption. For example, the DASH diet (Dietary Approaches to Stop
Hypertension) has been reported as including approximately 58%
calories from carbohydrates (Swain et al 2011 “Characteristics of
the diet patterns tested in the optimal macronutrient intake trial to
prevent heart disease (OmniHeart): options for a heart-healthy diet”)
and the TLC (Therapeutic Lifestyle Changes) diet recommends between
50% and 60% carbohydrate (Doucette and Kren, “The efficacy of using
the Therapeutic Lifestyle Changes diet for reducing comorbidities
associated with overweight and obesity”).
In addition to potentially deleterious
changes in HDL and triglyceride levels, advocates of low carbohydrate
diets argue that consumption of a high carbohydrate diet will result
in dangerous spikes in blood sugar as large quantities of
carbohydrates are broken down to glucose and absorbed into the
bloodstream (see, e.g. Jimmy Moore, Cholesterol Clarity, page 214,
quoting Dr. Dominic D'Agostino).
Finally, research by Sharman et al
(which I summarized previously) suggests that a
high carbohydrate diet could cause deleterious changes in
postprandial fat metabolism.
Because
of this pre-existing research, this study was also designed to test
the effects of the dietary intervention on postprandial
blood
sugar and triglyceride levels.
Review of a few long-term dietary interventions
Let's
say you are an astronomer. You are working on a project that requires
a long term observation of a particular celestial object. So you
program your telescope to collect a year's worth of data on the
object only to discover, at the end of the year, that the telescope
had been looking at the wrong part of the sky. So do you analyze and
publish the data you have, or do you start over and make sure your
telescope is looking at what you wanted to study in the first place?
Now
imagine you are a diet researcher...
I
reviewed a sampling of dietary intervention trials lasting 12 months
or longer to see what, if anything, they say about very high
carbohydrate diets versus very low carbohydrate diets. This was based
on a quick search and should not be considered comprehensive review.
I
did not find the reported research to be terribly useful for the
present study. With the exception of a series of papers examining the
very low fat Ornish diet, none of the studies seemed to achieve a
large enough difference in macronutrient intake between the different
groups study participants (or between the study participants at
baseline and at the end of the intervention) for me to consider them
relevant to my experiment (which involved a change in fat consumption
from approximately 60% to approximately 10%, excluding fat from
fish). (Note: I excluded a number of studies by Caldwell
Esselstyn because of his aggressive use of cholesterol-lowering
drugs).
The
table below shows the
percentages of fat consumption in highest vs. lowest fat consuming
study subjects. In cases where there was no control group, the
baseline diet is used for comparison. Diet-induced changes in HDL and
LDL cholesterol are also noted. I did not summarize changes in
triglycerides but they generally show the same trends as HDL – studies that showed an increase in HDL generally showed a decrease in fasting triglycerides.
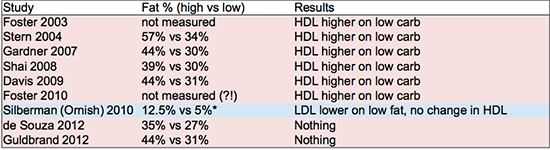 |
| Summary of changes in HDL and non-HDL cholesterol at conclusion of selected long-term dietary intervention studies. *Silberman et al fat consumption percentage was calculated from reported grams of fat consumed per day assuming a 2,000 calorie diet. |
References: Foster 2003, Stern 2004, Gardner 2007, Shai 2008, Davis 2009, Foster 2010, Silberman 2010, de Souza 2012, Guldrand 2012.
The
other studies could charitably be described as at best “mildly
effective” in achieving their dietary objectives. The numbers shown
in the table above for final macronutrient ratios are generally based
on surveys conducted on the participants at the conclusion of the
study (except for Foster, who did not survey the dieters in either
study and therefore apparently doesn't know what the subjects were
actually eating). There is a rather telling comment in de
Souza et al 2012: "despite
the intensive behavioral counseling in our study, macronutrient
targets were not fully met, which complicated the interpretation of
our null result." So they told different groups of people to eat
different diets, but they all ate basically the same diet. Their
outcome measures did not differ between groups at the end of the study (the “null
result”), and therefore interpreting the data is “complicated.”
Let me suggest, actually, that interpreting their data is "a
waste of time." (They published it anyway, of course.)
In
2004, Yancy
et al ran
a study of a very low carbohydrate ketogenic diet for 24 weeks. Two
of the subjects (out of 59) on the low carbohydrate diet dropped out
because of sudden increases in non-HDL cholesterol. Overall, 30% of
the subjects on the very low carbohydrate diet experienced an
increase in LDL cholesterol of 10% or more, compared to 16% of
subjects on the low fat diet (this difference was not statistically
significant). Because of its short duration, this study did not
qualify for inclusion in the summaries above. However, it does
support the hypothesis that a very low carbohydrate diet can raise
LDL in a minority of the people who try it (unfortunately Yancy et al did not report non-HDL levels in these individuals, which would have been much more useful). This is also supported by
anecdotal reports from individuals consuming very low carbohydrate
diets. As far as I know a study designed to test this hypothesis has
not been conducted.
Note:
the Silberman (Ornish) subjects started out on a very low fat diet,
and they transitioned to a diet much lower in fat. Even their
starting level of fat consumption is far lower than anything achieved
in the other “low fat” interventions summarized above.
By
the way, the Silberman study on the Ornish diet had 2,974 people in
the intervention group (it was not a controlled trial). It is
interesting that the Ornish researchers appear to be able to get
people to actually eat very low fat diets, while other researchers
seem to have more trouble getting participants to make such dramatic
diet and lifestyle changes. I'm not commenting one way or the other
on the Ornish plan, but it is a bit disappointing that the other
research groups don't seem to be able to effect such large changes in
macronutrient intake in their study participants. This means the
published studies are not especially helpful in evaluating diets at
the extreme ends of the macronutrient spectrum.
A
number of the Ornish studies observed short term reductions in HDL.
However, the longer studies seem to indicate that those HDLs rise
again over the long term (3-5 year timeframe). What is potentially
more troubling, however, is that the Ornish studies do not seem to
report a meaningful reduction in fasting triglycerides.
Fish oil studies
A
number of studies have investigated the effects of fish oil
supplementation on risk of cardiovascular disease. These have not
always found fish oil to be beneficial (see e.g. Risk and Prevention Study Collaborative Group "n-3
fatty acids in patients with multiple cardiovascular risk factors"
finding no benefit for cardiovascular mortality or morbidity).
However, these studies generally involve very low doses of fish oils,
on the order of 1 gram of total n-3 fatty acids per day. A study
will find no benefit if it uses an intervention that is too small, but this of course tells you nothing about the effects of a larger dose.
Some
studies using a larger dose (e.g. Harris et. al. Journal
of Lipid Research 1988, which used 24-28g omega-3 per day, and Phillipson et. al., New England Journal of Medicine 1985, which used approximately 20-25g omega-3 per day) have shown
a dramatic improvement in metabolic markers, including total and
non-HDL cholesterol, but these studies were short term and not
designed to observe changes in heart disease. Based on this I believe
it is more likely than not that a dose sufficient to improve
metabolic markers is likely to also have beneficial effects against
heart disease. The present intervention involves a very large intake
of n-3 fatty acids from fish.
Dietary cholesterol recommendations
It
is commonly heard that dietary cholesterol has at most a small
relationship to blood cholesterol levels. This seems to be the case
when cholesterol intake is high at baseline. For example, Ancel Keys
suggested that a reduction in dietary cholesterol from 600 mg to 300
mg per day on a 2,000 cal/day diet would be expected to result in a
reduction in total serum cholesterol of only 7.6 mg/dl ("Serumcholesterol response to dietary cholesterol," American Journal
of Clinical Nutrition 1984). According to Keys, the relationship
between dietary cholesterol and serum cholesterol is stronger at
lower levels of dietary cholesterol intake. Regardless of the
strength of this relationship, public health authorities continue to
recommend a reduced cholesterol diet as a preventive measure for
cardiovascular disease. The recommendation in the 2010 DietaryGuidelines for Americans is <300mg/day.
The figure below is reproduced from Endocrinology and Metabolism, Third Edition (Felig, Baxter and Frohman, McGraw Hill 1995, page 1368). It shows (hypothetically, I presume) the relationship between dietary
cholesterol and serum cholesterol. Consistent
with the Ancel Keys paper cited above, the curve has a decreasing
slope as dietary cholesterol increases, eventually leveling out. This
sort of pattern might be expected with a regulated biological
process, where the body seeks to maintain serum cholesterol at a
particular level regardless of input. In that case, the "ceiling," where the curve flattens out, may tell us something about what the
regulatory system is trying to achieve.


Personal motivation
Why did I do this? I have been tracking my cholesterol levels over the past few years since they have been generally higher than what is considered normal by mainstream medical opinion (without making any judgements about the validity of that opinion). In addition, since adopting a low carbohydrate diet in 2009, I have observed a slow but persistent trend towards increased total and non-HDL cholesterol. Therefore, I have tried a number of interventions to bring those numbers down. My intention is not to allow the blood lipid numbers to dictate my dietary choices. However, I believe an understanding how diet affects my blood lipids is useful information for making better choices about what to eat. I'd like to take into account all potentially relevant information.
I
first tried a low carbohydrate diet after reading Good Calories, BadCalories, just to see what would happen. It caused a number of health
improvements right away. During this time I noticed (with a
glucometer) blood sugar spikes after carbohydrate-containing meals
and was not sure if they were within a healthy range. I stayed on the
low carb diet because I felt fine and it seemed to have improved my
health. However, I had never tried a very high-carbohydrate diet and
wanted to see what would happen.
Hypotheses
This study was designed to test the
following hypotheses:
- A high carbohydrate, low fat diet can meaningfully reduce non-HDL cholesterol
- An increase in dietary carbohydrate lowers HDL and raises fasting triglycerides
- High carbohydrate diets cause excessive spikes in blood glucose throughout the day
- High carbohydrate diets impair postprandial triglycerides after an oral fat tolerance test
The diet, timeline and measurement
protocol were designed to evaluate these hypotheses. Based on prior
review of the scientific literature, I thought the first hypothesis
was false and the others were true.
Design and Methods
The study consisted of a single dietary
intervention phase conducted after long-term consumption of a very
low carbohydrate baseline diet (total carbohydrate intake averaging
less than 75g/day).
Approval of an Institutional Review
Board was not required for this n=1 self-experiment. The author's
mother and girlfriend were informed of the study design in passing
and they raised no ethical concerns. The study was conducted
according to ad hoc human subjects research guidelines made up on the
spot by the author, and reviewed and approved by the author as the
sole human subject.
Baseline diet
The baseline diet consisted primarily
of whole eggs (3-4/day), grass-fed red meat (450g/day on average),
butter (1/2 stick/day on average), almonds (30g/day on average),
non-starchy vegetables, and coffee (2 cups/day). For approximately
four weeks before the start of the intervention phase, carbohydrate
consumption was gradually increased to approximately 150g/day by the
addition of bananas to the baseline diet.
The intervention diet
The intervention diet consisted
primarily of white basmati rice (Swad "premium quality" Dehraduni aged basmati rice) and frozen wild coho or sockeye salmon (Trader Joe's). In
addition, a typical day included approximately one bunch of bananas
(1-2 pounds), 9.5 oz of grass fed whole milk yoghurt (Grazin' AngusFarms), 1 oz almonds, some sort of shellfish once or twice a
week, and a variety of green vegetables. A few meals a week would be
at restaurants and consist of whatever I wanted. The amount of rice
consumed varied to meet caloric needs and varied between approximately 450g and 565g (dry). Target vegetable intake was determined to roughly meet vitamin
requirements according to US daily reference intakes, but in practice
the requisite amount of green vegetables was often not achieved.
During peach, apricot, and cantaloupe season here in the Northeast
U.S., I ate, respectively, a lot of peaches, apricots and cantaloups.
 |
| 1.75 pounds of white basmati rice. 1 pound of fish. |
Carbohydrates:
I was looking for a relatively low-glycemic carbohydrate source. I
thought I would avoid sweet potatoes as they had appeared to lower myHDL in a prior short-term experiment. So I went with white
rice, a common global staple food. Basmati rice is reputed to have a
low glycemic index relative to other forms of rice, and I live a few
blocks from a South Asian neighborhood and therefore have a
convenient supply of high quality Indian rice in ten pound bags.
According
to my Endocrinology and Metabolism textbook (Felix, Baxter and Frohman, 3rd Ed.), the increase in fasting triglycerides and
corresponding decrease in HDL commonly observed in a high
carbohydrate dietary intervention occurs only when carbohydrate
intake is increased abruptly, and does not occur with a gradual
transition period (see page 1372). Therefore, the present study utilized a wash-in
period of several weeks during which carbohydrate consumption was
increased gradually from ~75g/day to ~150g/day.
Protein:
The intervention diet was designed to have approximately the same
protein content as the baseline very low carbohydrate diet. I use the
“one gram of protein per pound of body weight” rule of thumb
which is widely followed for active individuals looking to build or
maintain muscle mass (approximately 150g/day). Given the
somewhat mixed evidence on dietary cholesterol, I wanted to try
keeping cholesterol intake relatively low while obtaining this amount
of protein. Therefore, fish (primarily salmon and trout) was chosen
as a compromise between cholesterol content and high-quality, whole
food protein. Because of the target protein consumption, cholesterol
intake somewhat exceeded the mainstream guidelines for cholesterol of
300mg per day (see the 2010 Dietary Guidelines for Americans). Since I
was aiming to achieve my target protein requirements by eating fish,
I did not need to eat any of the "protein" sources such as
tofu, quinoa, beans, etc. that are commonly consumed on other low fat
and vegetarian diets.
Fiber:
The diet as implemented is relatively low in fiber. I briefly looked
into the research on fiber and did not feel compelled to go out of my
way to consume it. Because of that I chose white rice as my staple
carbohydrate instead of brown.
Measurements
Periodic
measurements of total and HDL cholesterol were taken with a
CardioChek PA meter. In addition, after 8 weeks of the
intervention diet, a comprehensive blood and urine analysis was
performed, including Atherotech VAP lipoprotein testing (Shiel
Medical Laboratories, Brooklyn, NY) and compared with a similar panel
taken one year prior during the baseline diet (high in red meat,
butter and green vegetables but excluding grains, legumes and
non-butter dairy).
Postprandial testing
After
adaptation to the very high carbohydrate diet for at least 8 weeks, I
conducted a number of postprandial tests. First was a standard oral
glucose tolerance test using 75 grams of glucose (Kalustyan's, New
York, NY) dissolved in New York City tap water.
I
also attempted a “real food” torture test by adding a 9"
cantaloupe to a typical dinner of wild salmon. I have no idea how
much glucose was in that particular cantaloupe but I believe it must
have been substantially more than 75 grams. In order to simulate
“worst case” conditions, I wolfed it down as fast as possible,
which took about 10 minutes.
In
order to test my hypothesis about the effects of a very high
carbohydrate diet on postprandial triglycerides, I conducted an oral
fat tolerance test based on a typical breakfast I consumed during the
last year of my low carbohydrate diet. This consisted of four eggs
(Grazin' Angus Farms) cooked (over easy) in coconut oil, plus
half a stick of butter. This is more fat, more saturated fat and more
cholesterol than is typically used for oral fat tolerance tests in
research settings, though contrary to most researchers I did not
include any carbohydrates (or wheat) in my test. For these reasons my
results will not be directly comparable to any oral fat tolerance
test from the research literature (which is just as well, because, due to lack of standardization, published results are rarely comparable to each other). However
it does have the virtue of being directly comparable to oral fat
tolerance tests I have performed on myself and written about before. I have noticed previously that triglycerides after a meal
may be very low on the day after heavy exercise. Therefore I
conducted my oral fat tolerance test for this experiment on a day
after a day on which no heavy exercise was performed.
Analysis
Results
were recorded using the iPhone Notes app and bits of paper and
plotted in R. Statistical analysis was not considered necessary or
useful for this experiment. I also did not need WiFi, Bluetooth, a
proprietary machine learning algorithm, The Cloud, Web 2.0, or any
other fancy technology.
Results
After adaptation to the very high carbohydrate diet for at least 8 weeks, I conducted a number of postprandial tests. First was a standard oral glucose tolerance test using 75 grams of glucose (Kalustyan's, New York, NY) dissolved in New York City tap water.
Analysis
Results were recorded using the iPhone Notes app and bits of paper and plotted in R. Statistical analysis was not considered necessary or useful for this experiment. I also did not need WiFi, Bluetooth, a proprietary machine learning algorithm, The Cloud, Web 2.0, or any other fancy technology.
Results
Executive Summary
I observed the following changes on the intervention diet compared to baseline:
- Very large decrease in non-HDL cholesterol, LDL cholesterol and oxidized lipoproteins
- No change in HDL cholesterol or fasting triglycerides
- decrease in serum uric acid
- No adverse postprandial responses to high carbohydrate or high fat meals
- Seasonal allergies returned
- Intervention diet (as implemented) may be insufficient in B vitamins
Cholesterol levels
The figures below show my non-HDL and
HDL cholesterol levels during the baseline (low carbohydrate, red)
and intervention (high carbohydrate, blue) diets. The reduction in
non-HDL was immediately evident by the first measurement, which was
taken after only 7 days on the high carbohydrate diet. No clinically
meaningful change is evident in HDL cholesterol.
 |
| Non-HDL cholesterol on baseline (low carbohydrate, red) and intervention (high carbohydrate, blue) diets. |
 |
| HDL cholesterol on baseline (low carbohydrate, red) and intervention (high carbohydrate, blue) diets. The increase in the 2.5-3.5 year period roughly corresponds with high butter consumption. Note the downtrend towards the later part of the high-butter period. |
Fasting
triglycerides were essentially unchanged (57 on 4/3/2012 to 63 on
5/31/2013).
Advanced lipid testing
Direct LDL measurements performed on
April 3, 2012 (on the baseline diet) and again on May 31, 2013 (after
8 weeks on the very high carbohydrate diet) revealed a decrease in
total LDL (direct measurement via the Atherotech VAP) from 190 mg/dl
to 77 mg/dl.
 |
| Results of advanced cholesterol testing (Atherotech VAP). |
Oxidized LDL and HDL
Along with the decrease in non-HDL
cholesterol, oxidized LDL decreased from 62 to 35 mg/dl and oxidized
HDL decreased from 36 to 19.
Blood sugar control
The figure below shows the results of
an oral glucose tolerance test done on the morning of June 7, 2013.
My blood sugar reached a peak of 152 at 45 minutes and returned to
baseline within 2 hours.
 |
| Blood sugar in response to an oral glucose tolerance test containing 75 grams of Kalustyan's glucose dissolved in New York City tap water. |
The figure below shows my blood sugar
over most of a typical day (in this case, May 28, 2013). The majority
of my carbohydrate consumption was in the late morning and over lunch
(12-1 pm). For reference, approximately 4 bananas and two pounds
(cooked) of basmati rice were consumed before 1 pm. As you can see,
no abnormally high or low blood sugar levels were observed. The
highest reading for the day was 126 mg/dl.
 |
| Blood sugar readings over the course of a typical day on a very high carbohydrate diet. |
Hemoglobin
a1c is a measure of glycated hemoglobin. It varies from person to
person and may also depend on average lifespan of red blood cells, so
it has some limitations as a biomarker, but it is considered a useful
measure of heart disease risk, to the extent that it may be mediated
by long-term elevations in blood sugar. This year, after two months
on the high carbohydrate diet, my hemoglobin a1c was ever so slightly lower than it has been previously on the low carbohydrate
diet (5.6% on 4/3/2012 vs. 5.5% on 5/31/2013).
The
standardized 9” oral cantaloupe tolerance test resulted in a
maximum postprandial blood sugar of 107.
Triglycerides
Below are the results of an oral fat
tolerance test conducted on July 30, 2013 according to the protocol described above.
 |
| Triglycerides before (t=0) and after (t=150 and 210 minutes) a high fat test meal consisting of four eggs, five tablespoons of coconut oil and 1/2 a stick of butter. The peak value of 111 mg/dl occurred at 150 minutes. |
Allergies and hives
One of the clearest benefits I noticed
when I started eating a very low carbohydrate diet was a sharp
reduction in my seasonal allergies. On the very high carbohydrate
intervention diet, my spring allergies returned. In addition, over
the first 3 weeks of the diet, I started getting hives. The hives
went away after the first three weeks, and so have the allergies. The allergies returned during the fall allergy season (October).
Uric acid
One unexpected benefit of the very high
carbohydrate diet was a reduction in serum uric acid, from a slightly
high 8.3 mg/dl on 4/3/2012 to 6.8 on 5/31/2013. I have not
investigated the likely cause or meaning of this change, but my lab
defines the reference range as 4.0-8.0 mg/dl, and elevated uric acid
levels are associated with impaired kidney function.
Homocysteine and c-reactive protein
Initially, an increase in homocysteine
and c-reactive protein was observed (as of 5/31/2013). Elevation in
homocysteine may have been related to a deficiency in B vitamins and
supplementation was commenced (25mg B6, 2,000 mcg B12 and 1,600 mcg methyl-folate).
Elevation in c-reacitve protein is believed to be caused by a minor
viral infection at the time the May 2013 blood work was conducted.
Homocysteine and c-reactive protein
were retested and confirmed within normal range on 8/23/2013.
Discussion
Interventions
that make small changes to macronutrient composition may
be expected to result in small changes in blood lipids. Studies like that require statistical analysis with n>>1 to reasonably
reject the null hypothesis that a particular dietary intervention
results in no change, or no improvement, in health or biomarkers. The
present study was designed to induce a large change in blood lipids
by way of a very large change in macronutrient intake. As with all
diet studies, it necessarily involved a change in multiple dietary
factors as certain foods were reduced or eliminated (e.g. red meat),
and others were increased (e.g. fish). Therefore, it is not possible
to determine whether the effects observed were the result of changes
in macronutrient content, or of other concurrent changes.
It
seems reasonable to assume that the effects of macronutrient changes,
if any, may not be linear. For example, it may not be possible to
infer the effects of a diet comprised of 65% carbohydrates from a
study population consuming no more than 55% carbohydrates on average.
This fact may help explain the results of the dietary intervention
studies, where the only interventions involving fat consumption below
10% of calories (the Ornish studies) were able to demonstrate
decreases in non-HDL cholesterol. In addition, studies are usually not designed to detect instances where a subset of the population shows an unusually large response to one intervention or another.
Contrary
to my initial assumptions, this experiment strongly supported the
hypothesis that a very high carbohydrate diet can lower non-HDL
cholesterol. In addition, it failed to support the hypotheses that
high carbohydrate diets lower HDL, raise triglycerides, cause
unhealthy blood glucose spikes and impair oral fat tolerance. Again,
it may be the case that these effects occur only in a subset of
the population, but this hypothesis has not been confirmed or refuted
because of the design of the dietary intervention studies I reviewed.
Fasting measurements
My
HDL levels on the very high carbohydrate diet were consistent with
their levels during the first few years of the low carbohydrate diet,
prior to the year of high butter consumption. However, given the
study design (n=1) and the natural variability in cholesterol levels
from day to day, this study is not powered to detect small decreases
in HDL. And why would I want to detect a very small decrease in HDL?
A small decrease most likely won't make any difference to me
personally. I had previously conducted a 4-week study of the effects
of adding sweet potatoes to a very low carbohydrate diet. I observed
a decrease in HDL during this time which was reversed once the sweet
potatoes were removed. My current results are not consistent with
that finding, or with other results (unpublished) suggesting that my
postprandial triglycerides are adversely affected by carbohydrate
consumption.
A
number of plausible solutions to this conflict are i) certain
carbohydrates (e.g. sweet potatoes adversely affect HDL
and triglycerides, while others (e.g. white rice) do not; ii)
carbohydrates lower HDL and raise fasting triglycerides when eaten
with fat, but not in the context of a very high carbohydrate diet
where fat intake is low; iii) high fish consumption counteracts any
adverse effect on HDL and triglycerides that would otherwise have
occurred; and/or iv) as suggested by my Endocrinology and Metabolism textbook, the
several week wash-in period during which carbohydrate consumption was
gradually increased was effective in preventing these adverse
changes.
High
carbohydrate diets are often claimed to cause deleterious changes in
LDL particle size. However, in my case, advanced lipid testing
performed on May 31, 2013 reveals favorable changes in all
lipoprotein subtractions. Total small, dense LDL particles (LDL 3 and
LDL 4 on the VAP test) decreased from 99 mg/dl on April 3, 2012 (on
the baseline low carbohydrate diet) to 37 on May 31, 2013 (8 weeks
into the very high carbohydrate diet). Larger LDL subtractions also
decreased but by a smaller absolute and relative amount (91 to 40).
Therefore, the dietary intervention has apparently caused a favorable
shift in both the ratio of large vs. small LDL particles, and also in
the absolute amount of small, dense LDL. There was also a small
decrease in VLDL, from 16 to 14 mg/dl.
There
was also a slight favorable shift in HDL subfractions. While the
total HDL cholesterol was essentially unchanged (68 mg/dl on 4/3/2012
to 69 on 5/31/2013), the balance between large/buoyant HDL 2
(believed to be most protective) and the small/dense HDL-3 shifted
from 19/49 to 22/46. However, this change is small and it is not
clear if it has any clinical relevance.
My
measurements of oxidized lipoproteins also contradict a common belief
in low-carbohydrate diet communities: that reduction in carbohydrate
consumption will reduce lipoprotein oxidation and therefore reduce
heart disease risk regardless in changes in total lipid levels. (See,
for example, the quote from Jefrey Gerber on page 87 of Jimmy Moore's
Cholesterol Clarity). He says that lowering carbohydrates will lower
oxidation, but my oxidized lipids decreased enormously on this diet.
In addition, while the decrease in oxidized LDL would be expected
given the large decrease in total LDL, there was also a large
decrease in oxidized HDL despite total HDL levels remaining
essentially unchanged. While the absolute level of oxidized LDL
decreased from 62 to 35, on a relative basis as a percentage of total
(direct) LDL, it increased from 33% to 45%. Oxidized HDL decreased on
a percentage basis from 53% to 28%.
The
elevation in homocysteine suggests that the diet as implemented
provided inadequate B vitamins. Although the design of the diet
included a substantial amount of B vitamin-containing green
vegetables, the diet as implemented did not. Supplementation (25 mg
B6, 1600 mcg methyl-folate and 2000 mcg B12) rapidly reversed the
adverse change in homocysteine.
Postprandial measurements
Because
of the human body's ability to adapt to a wide variety of diets, I
had assumed at the outset that improvements in postprandial blood
sugar control may occur in response to the very high carbohydrate
diet, and that this would likely produce a normal oral glucose
tolerance test response. In fact my glucose tolerance test results on
the very high carbohydrate diet are considered to be within normal standards. Note that, although the 2-hour reading
(70) is lower than the fasting level, I was not at any time
symptomatic of hypoglycemia.
You
can contrast the oral glucose tolerance test result with the full day
blood sugar measurements. Even though the glucose tolerance test
involved the consumption of a much lower dose of carbohydrates (75g),
it produced a dramatically higher blood sugar excursion than the
worst case seen during a full day (500g carbohydrates). This suggests
that the oral glucose tolerance test is not representative of an
actual day of very high carbohydrate eating (though perhaps it may be
representative of junk food or soft drink consumption).
Some
people are afraid to eat fruit these days because of concerns about
blood sugar. My postprandial blood sugar after the oral cantaloupe
tolerance test peaked at 107, so I'll say with confidence that I am
not likely to run my blood sugar up to unhealthy levels while eating
real foods. Note that the protein consumed along with the cantaloupe
likely triggered an insulin response that could have reduced the peak blood sugar level.
  |
| Left: the aftermath of a standardized 9” oral cantaloupe tolerance test. My peak blood sugar of 107 is shown on the glucometer. The cantaloupe was very ripe and delicious. Right: 75 grams of glucose. Yikes! |
Eating a very high carbohydrate diet might be expected to lower your postprandial response to carbohydrates. However, it might also be expected to worsen your postprandial response to fats, because a very high carbohydrate diet is necessarily very low in fat.
On
the very low carbohydrate diet, my peak triglycerides after a typical breakfast (described above) would occur around 3.5 hours
after the meal and would usually reach approximately 155 mg/dl. On
some days, particularly if I had done some extremely heavy exercise
the day before, my peak triglycerides would reach only 100 mg/dl.
On
the very high carbohydrate diet, my triglycerides after this test
meal stayed admirably low (111 mg/dl). Although it is impossible to draw firm
conclusions from a single test (since peak postprandial triglyceride
levels can vary significantly from day to day and the reasons for
this variability are not entirely clear), this is nevertheless a
surprising result. Based on my prior research, I was expecting my oral fat tolerance to be impaired on
the very high carbohydrate diet, and that this would be evidenced by
a higher and possible also a later peak reading. If anything, this
result suggests an improvement in oral fat tolerance. The results,
taken together, therefore suggests a true improvement in metabolism
with no observable metabolic downsides.
Odds and ends
The
return of my allergies on the very high carbohydrate diet was not
entirely unexpected, because I had suffered from seasonal allergies
fer years prior to adopting the low carbohydrate diet. They ended
after a few weeks, which may have been due to the end of allergy
season, or possibly because of a quercetin/bromelain supplement
suggested by my doctor. My typical October seasonal allergies also
returned, and also may have responded to the same supplement. At this
point it is impossible for me to separate the effects of the
supplement from the end of each allergy season. The hives were
unexpected, but temporary and I have no reason to think they will
come back.
One
of my concerns in transitioning to a very high carbohydrate diet was
with my teeth. However, I have not noticed any increase in root
sensitivity or other adverse dental health effects.
Competing financial interest disclosure
The author does not declare any
competing financial interests. The author also declares affirmatively
that he has no competing financial interests related to this
research that an ethical person would feel ethically obligated to
declare.
Conclusions
The
present study demonstrated a dramatic reduction in non-HDL
cholesterol in a short period of time in connection with the adoption
of a very high carbohydrate, non-vegetarian diet. Improvements were
also seen in oxidized lipoproteins, uric acid, and postprandial fat
and carbohydrate metabolism. Seasonal allergies, which were
virtually eliminated on the very low carbohydrate diet, returned upon
adoption of the very high carbohydrate diet. No other
deleterious effects were observed other than an increase in
homocysteine which was reversed through B-vitamin
supplementation, suggesting the diet as implemented provides
inadequate B vitamins. The diet is inexpensive and sustainable,
though long-term effects (post 7-months) are not yet known.
How often did you have to eat sweet potatoes to see the negative effect on HDL? I would be curious to see how white potatoes did under similar circumstances. Were there any changes to your weight or body comp during this experiment?
ReplyDeleteI ate one sweet potato a day (approximately 100g carbs each). The full writeup is here. No change in weight or body comp in that experiment or this one.
DeleteWrong,
ReplyDeleteOrnish did report triglyceride levels, they went up and later came down. A moderate rise in triglycerides and a drop in HDL coincided with a marked reduction in coronary events. Shouldn't this fact tell us something about the causal nature and importance of biomarkers in the lipid fraction. The patients in the intervention arm dropped their LDL on average 40% in 12-weeks which is comparable to Atorvastatin (lipitor).
http://www.ncbi.nlm.nih.gov/pubmed/15504577
HDL-C and triglycerides are not causally related to CHD unlike LDL-C, we have plenty of genetic evidence from mendelian randomization studies to back this up. Willett knows about cardiovascular research and these lines of evidence as much as a pig appreciates watches made by Patek Philippe.
A meta-analysis of mendelian randomization studies with over 312,000 individuals demonstrated that inheriting any of nine studied genetic variants that modify lifelong LDL cholesterol concentrations, but not any other known risk factors predicted a 55% lower risk of coronary heart disease for each mmol/l (38.7 mg/dl) lower LDL cholesterol. This represents a three-fold greater reduction in coronary heart disease per lower unit of LDL cholesterol than the statins trials which lasted only 5 years and the average participant age was 63. The p-value for this finding was 0.000000000000000000843. This is also expected to also translate into a 3 fold lower risk of all-cause mortality. The authors concluded:
“We found no evidence of any heterogeneity of effect on the risk of CHD per unit lower LDL-C among any of the polymorphisms included in our study. This lack of heterogeneity of effect strongly suggests that the results of our study are unlikely to be significantly confounded by pleiotropy or linkage disequilibrium because it is unlikely that each of the included polymorphisms are acting through similar pleiotropic effects or have similar linkage disequilibrium patterns… This finding suggests that the effect of long-term exposure to lower LDL-C on the risk of CHD appears to be independent of the mechanism by which LDL-C is lowered. Therefore, the method of lowering LDL-C is likely to be less important than the magnitude and timing of LDL-C reduction. As a result, diet and exercise are probably as effective at reducing the risk of CHD as are statins or other treatments that lower LDL-C when started early in life (and when measured per unit lower LDL-C).”
Hi. Of course the Ornish studies reported triglyceride levels. What I said was that his patients did not seem to see a meaningful reduction in triglycerides. In Silberman (cited above), triglycerides on average went from 179 to 160 mg/dl. Ornish's 2003 report on the Multicenter Lifestyle Demonstration Project (Koertge et al Am J. Cardiol) reported triglycerides changing from 232 to 231 (men) and 215 to 221 (women). Most would consider these ending values to be too high. I suspect eating some fatty fish could help.
DeleteI'll have to take a closer look at the genetic studies.
What do you suggest,
ReplyDeleteDid Ornish treat the fire by wrong means or does your take on triglycerides need an update? That's the question! Do you have any studies on people who have experienced an open heart surgery, are put drug-free therapy and yet show a regression heart disease? We must keep in mind that nearly all studies have tested to Mediterranian diet f.ex (Lyon, PREDIMED, etc) people have reaped benefits only at the top of the full cavalcade of diurectics, statins, blood-pressure medications, etc.
As global epidemiology shows us, the people who have traditionally enjoyed relative immunity from CHD have rather low HDL-C's together with somewhat high triglycerides. I only state that RISK PREDICTOR is not identical to CAUSAL FACTOR. Poverty in Western population is a risk predictor for CHD, but it's not a similar risk predictor in, let say rural China of the 1980s. Likewise, HDL-C at the low end or somewhat elevated triglycerides were not an issue in Okinawa. However, no matter what population you have, lowering LDL is beneficial by itself, that's because LDL is a causal risk factor.
Here's another:
Causal Relevance of Blood Lipid Fractions in the Development of Carotid Atherosclerosis: Mendelian Randomization Analysis.
Conclusion: Our findings confirm a causal relationship between LDL-C and CIMT but not with HDL-C and triglycerides. At present, the suitability of CIMT as a surrogate marker in trials of cardiovascular therapies targeting HDL-C and triglycerides is questionable and requires further study"
http://www.ncbi.nlm.nih.gov/pubmed/23275344
I'm not really suggesting anything. Like I said in the post, I'm not drawing any conclusions about heart disease. Only the potential relationship, in one individual, between diet and non-HDL. If I do further research and write something about heart disease, I will take a look at the links you are sharing. And thanks for posting those.
DeleteIn my prior comment I suggest that the Ornish subjects might have done even better if they ate some fatty fish. I'm not aware of any lines of evidence that suggest fish are bad for people to eat, though I have not exhaustively researched the topic. Anyway I think this would be a good experiment. It would probably only take a week or two to see if it was raising non-HDL and/or lowering triglycerides in these patients. The research I cited on high fish-oil diets suggests it could lower both non-HDL and triglycerides. Of course lots of things that improve lipids are not good for you, so its effect on heart disease if any would take much longer to determine.
BTW,
ReplyDeleteI'd like your writing pretty much, apart from few details.
Ornish do not feed his patients fatty fish because he believes that is its extremely crucial for CHD patients to avoid dietary cholesterol, and according him (and many others) dietary cholesterol influences CHD over and above its effect on serum cholesterol.
It has been observed that the long-term feeding of cholesterol and saturated fat has resulted in heart attacks, sudden death, development of gangrene, softening on the bones and numerous other serious complications in nonhuman primates. For example, it has been shown that when diets rich in cholesterol and saturated fat are fed to monkeys of the genus Macaca, including the rhesus monkey and the crab-eating macaque, they experience heart attacks at approximately the same rate as high-risk populations living in developed nations.
It has also been demonstrated that the cessation of a cholesterol-rich diet and the subsequent lowering of serum cholesterol results in the regression of atherosclerosis in various mammalian and avian species, including herbivores, omnivores, carnivores and nonhuman primates. In one experiment Armstrong and colleagues induced severe atherosclerosis in rhesus monkeys by feeding a diet with 40% of calories from egg yolks for 17 months. The egg yolks were then removed from the monkeys diet and replaced with a cholesterol-free diet with either 40% of calories from corn oil or low-fat chow with 77% calories from sugar for three years, resulting in a reduction of serum cholesterol to <140 mg/dl and a marked regression of atherosclerosis.
Unfortunately, these lines of evidence have been consistently neglected by the promoters of cholesterol and saturated laden diets. As noted by Stamler (2011) in a response to S-T meta-analysis:
“To neglect this fact in a review about humans is to imply that the Darwinian foundation of biomedical research is invalid and/or that there is a body of substantial contrary evidence in humans. Neither is the case”.
http://ajcn.nutrition.org/content/91/3/497.full
The macaque model is interesting, though the cynomolgus monkey consumes primarily fruits and seeds in the wild. You might expect it to be ill-adapted to a high fat, high cholesterol diet. In fact, in one monkey study I looked at (Farrar et al 1982), serum cholesterol went from 121 to 736 on a high fat, high cholesterol diet. Humans do not respond this way absent familial hypercholesterolemia. I've only taken a quick look but monkey models seem to show a dose-response relationship between dietary and serum cholesterol without the "ceiling" effect that humans show, as I discussed in the original post.
DeleteHumans really do have a unique combination traits that have had an influence on our diet: use of fire, large brains, tools, throwing ability, domestication, fermentation, salt tolerance, etc. So I'd say the animal research is interesting but not dispositive (which doesn't mean it is wrong). Humans can have a different response to dietary nutrients than every other animal on the planet, yet still not prove the existence of god and/or disprove the theory of evolution.
Yeah,
ReplyDeleteI agree, although, if evolution has any predictive power then stimuli should have a similar (albeit not identical) effect across similar, closely-related species. We cannot lock bunch of people and feed them butter, egg yolks and lard and see what happens on long-term. However, I must there are plenty of examples of non-FH patients who are mega-responders to both dietary cholesterol and saturated fat, the most reknown example is probably Vlhjalmur stefansson who showed TC of 800 after his Inuit experiment. Moreover, a case report found that a 30-year-old woman with a healthy body weight who had been following a carbohydrate restricted diet for three and a half years had developed xanthomas on her hands and a chronically elevated serum cholesterol level of 940 mg/dl. The composition of the woman’s diet was reported as follows:
"Each day she had consumed eight to 12 eggs, one or two lean steaks or half a small chicken and, half to one litre of milk. Sometimes some cottage cheese or tomatoes enriched the menu and, on rare occasions, fruit. She completely avoided butter, bread, potatoes, rice, noodles, alcohol, or any other food or beverage containing carbohydrate. The daily cholesterol intake, which was mainly derived from the egg yolks, was about 3500 mg. The total calorie intake was about 8-4 MJ (2000 kcal) (35 % protein, 55 % fat, and 10 % carbohydrates, polyunsaturated fat:saturated fat (P:S) ratio=0 26)".
The woman was advised to change her diet, and in particular to stop eating eggs. After 16 days her serum cholesterol dropped to 750 mg/dl, and after several years dropped to 188 mg/dl and the lipid deposits on her skin had cleared up.
http://www.ncbi.nlm.nih.gov/pmc/articles/PMC1639741/
Excellent, thanks for posting.
DeleteGood work. Thanks for sharing and taking the time to illustrate your findings. I personally appreciate what I perceive to be your lack of bias and a terrific objective analysis. I'm also surprised by what you've observed and a bit skeptical that the long term experience would mirror the short term benefits.
ReplyDeleteFor example, I've don't recall having ever saw a person eating "high-carb" or SAD for years with trigs as low as yours. They always seem to have much higher trigs than your "high-carb" trigs. Do you concur and why do you think this may be?
Insulin resistance can take years to increase, do you think eventually (on high-carb) your sensitivity to Insulin will degrade?
Thanks for your comments. My results surprised me too. In the second paragraph under "fasting measurements" in the "discussion" section I list a couple of theories why my HDL/trigs may not have gone up. As for why others may have a different response to a high-carb diet, perhaps the triglyceride-raising effect is not caused by carbs per-se but by the type of carb or something else on the SAD or the more standard high-carb interventions (which tend to be vegan or vegetarian and low in protein as well). My diet was high in carbs but otherwise pretty unusual compared to what most people try.
DeleteGreg,
ReplyDeleteAs always, a fascinating posting on your n=1 study. Obviously, the standard Paleo/LCHF semi-religious pronouncements are only a small part of the story. (Except for those pesky Kitavans.) I'm curious if you noted any apparent changes in mental clarity, mood, anxiety levels, or libido between your baseline and high-carb diets.
Thanks! Nope, didn't notice a change in any of those factors compared to baseline. Hormone-wise (comparing the 2012 and 2013 full lab results), my TSH and sex-hormone binding globulin dropped a lot on the high carb diet. Although total testosterone was slightly lower (but still at a good level), free testosterone increased on the high-carb diet because of the drop in SHBG. However, I'm not sure you can draw meaningful conclusions from these numbers.
DeleteHi Greg- had a quick question about the blog but couldn't find your email. If you could, please email me at mtrucillo(at)recallcenter(dot)com. Thanks!
ReplyDeleteThe easiest way to get in touch with me is to friend me on Facebook.
DeleteDear Greg:
ReplyDeleteThis is fascinating! Thank you for doing this and writing it all up. How did you glucose tolerate test while on the high-carb diet differ from those on your previous low-carb diet? (Because I wonder if even lower than a high of 120 is even better.)
Hi and thanks for stopping by. I was not in the habit of doing true OGTTs while on low carb, it is well known that people typically do worse in response to a 75-100g pure glucose solution unless they reintroduce carbs for a few days. It did not seem like a useful exercise because I was not eating carbs on the low carb diet, and especially not pure liquid glucose. I will check my notes though to see if I may have done one at some point. I don't think so though because I remember being surprised to see how massive 75 grams of dry glucose looks.
DeleteThe tests with high carb real foods were dramatically better than the OGTT, so I'm inclined not to pay too much attention to OGTTs. After reviewing some of the blood sugar / insulin regulation literature and mathematical models, I think the OGTT is probably too far removed from a real meal to be worth paying much attention to -- I would guess that things like neural regulation and first-phase insulin response are entirely non-physiological in the OGTT context (unless you are routinely chugging something like two cans of a high sugar soft drink).
Max full-day blood sugar for a typical day was 126, after eating four bananas and two pounds of white rice. The 9" cantaloupe, which I ate as fast as I could manage, maxed me out at 107. So compared to a max reading of 152 at 45 minutes on the OGTT, I don't think the OGTT is indicative of any high carb diet or abusrdly large piece of fruit.
I did compare my oral fat tolerance test (OFTT) before and after the high carb diet. However, the results of that test are not very consistent from day to day. Some of my numbers on the low carb diet were not great, others were comparable to what I saw on the high carb diet (as shown in the post above). This was a big surprise to me as I would have assumed fat tolerance goes down on a very high carb diet.