Tuesday, May 15, 2012

A Case of Physics Envy?

With the airing this week of the HBO obesity documentary "The Weight of the Nation," reporting on the obesity epidemic has reached a fever pitch. I wanted to take a break from my usual programming to mention an article I saw today in the New York Times entitled "A Mathematical Challenge to Obesity."

Until now, mathematical hubris has been mostly the province of economic forecasters and financial risk modelers. As we have seen many times, if you do not fully understand the system that you are modeling, your model will be junk even if you think it's the greatest thing in the world. Now it seems the modeling bug is looking to infect the nutrition field.

The article is an interview with a mathematician who works for the National Institute of Diabetes and Digestive and Kidney Diseases, a division of NIH that I never knew existed. The mathematician, in an act of physics envy, claims to have created a model of a human being based on a single equation. I thought I would just re-print the email I wrote to Claudia Dreifus, who is the Times writer who conducted the interview. Text in brackets are for context if you have not yet read the article (they were not in my email to Ms. Dreifus).
"I read your interview with Carson Chow and had a few questions. 
1. Mr. Carson claims to have proven that increased food availability "caused" the obesity epidemic. He says that if there is extra food, people eat more. Yet animals typically do not become obese under "ad libitum" conditions (i.e. unlimited  food availability). Why are humans different and how does Mr. Carson's mathematical model "prove" that?
2. How does he know the increase in food availability is a cause and not a result of the obesity epidemic? The alternative hypothesis is that people are hungrier than they were before, and since they want to eat more, the food system produces more.
3. Why does Mr. Carson say that all diets work, when the clinical studies on diets almost invariably show that they don't work over the long term? If Mr. Carson has not done any experiments, how can his work prove that dieting works at all?
[Carson Chow said "it's so easy for someone to go out and eat 6,000 calories a day."]
4. Has Mr. Carson tried eating 6,000 calories a day for more than a couple of days? I don't think it is so easy, and professional bodybuilders and powerlifters often say that eating that much is the hardest part of their sport.
5. I tried the bodyweight simulator on the NIDDK site. Mr. Carson's mathematical model says that if I go from a very low carbohydrate diet to to a 6,000 calorie diet consisting of 100% carbohydrate, I would be able to gain hundreds of pounds within a week while maintaining a single-digit body fat percentage. While I agree that carbohydrates can cause weight gain for some people, that result is a little hard to swallow. Did the New York Times check the calculations to confirm they produced sensible results before interviewing Mr. Carson?"
I will update the blog if I get a response.

That last point is the most interesting to me. I believe the sports world will change forever once athletes realize they can gain nearly 750 pounds of lean mass in a week, without exercising. It is amazing nobody has taken advantage of this phenomenon before, and the first football team fielding multiple 900+ pound players is sure to be a favorite next season.

Here is a screenshot from the simulator showing this absurd result. The mistake probably stems from having "baseline calories from carbs" alone in a denominator somewhere (the app at least will not let you set this value to zero, so they caught that part of the bug).


Thursday, April 19, 2012

The Microbiome and Insulin Sensitvity

One of the largest organs in your body is technically outside of your body. It is the microbiota in your intestines. It comprises 90% of your cells and 99% of your genes. This organ regulates, and is regulated by, your immune system, your digestion and metabolism, and it even makes a whole bunch of neurotransmitters. It is very complex and interesting. I am going to discuss one recent study which should introduce some of the experiments I will be writing about over the next couple of weeks. Thanks to "This Week in Microbiology" (one of the best things on the entire Internet) for bringing this study to my attention.

John Ioannidis has written about the fact that many of the results in the biomedical research literature have never been replicated. And when scientists do try to replicate prior results, they often get contradictory outcomes. Contradictory results are part of science, and they are a sign that new hypothesis need to be considered. This paper is a great example of that.

The paper was published by Caricilli et. al. in December, 2011 in PLOS Biology and is entitled "Gut Microbiota is a Key Modulator of Insulin Resistance in TLR 2 Knockout Mice." The team of Brazilian scientists was working with mice that had been genetically modified to knock out the gene for toll-like receptor 2 (TLR 2), a component of the innate immune system. They found that these mice were insulin resistant and went on to develop a phenotype reminiscent of obesity and type 2 diabetes. This is in contrast to previous studies that showed the opposite effect in TLR 2 knockout mice. Same experiment, opposite result.
Three experiments from three labs.  Conflicting results.

The Brazilian team came up with a new hypothesis that might be able to explain all of the results. They showed that the genetic modification to the mouse's innate immune system resulted in changes to the composition of the mouse's gut flora. They believe that the gut flora, in turn, altered the mouse's insulin sensitivity. The effect depends on the flora present in the local environment in which the mouse is raised. This would be expected to vary from one lab to another. Therefore, a TLR2 mouse's insulin sensitivity may go up in some labs and down in others. The Brazilian team was careful to ensure that the mice they were using were raised not just in the same lab, but in the same room. Now that's some careful science.


The scientists characterized the gut flora of their control and TLR2 knockout mice (via sequencing 16S ribosomal RNA). They observed that firmicutes (a phylum of mostly gram-positive bacteria) are increased in their insulin resistant mice. When they transplanted this altered flora into healthy mice, they became insulin resistant too. When they used antibiotics which selectively kill off firmicutes in the TLR2 knockout mice, they went back to being insulin sensitive. Imagine that -- could we cure diabetes with antibiotics?

If you've read this far, you might be curious about your own microflora. Simply ship your feces to Metametrix and they'll analyze it by the same or a similar technique to that used in this paper. If you're insulin resistant, perhaps you have excess firmicutes and there may be strategies you can use to kick them to the curb. Of course mouse experiments do not necessarily translate to humans and healthy flora for a mouse will certainly differ from what is healthy in humans, but excess firmicutes have been found to be associated with obesity and diabetes in humans (in some but not all studies). Firmicutes have also been found to be reduced following gastric bypass surgery. A recent review paper by Tilg and Kaser (Gut Microbiome, Obesity, and Metabolic Disfunction) summarizes these findings. Of course, this information could turn out to be entirely useless -- perhaps it is not the categories of bacteria that matter, but specific strains, or the specific genes carried by (or expressed by) those strains. The interesting effects could depend not on what is there, but on the specific niches that particular strains have colonized (information that probably cannot be obtained from stool testing). We'll have to wait and see as this work is elaborated with new research, including the results of the Human Microbiome Project.

Is your Microbiome a Gland?


I mentioned above that the microbiome is in constant communication with your immune system and metabolic regulatory pathways. We saw from the Caricilli paper that changes in the microbiome can alter insulin sensitivity. One of the signaling molecules involved in this communication is lipopolysaccharide, or LPS. This is a component of the cell walls of gram negative bacteria. Your immune system is exquisitely sensitive to it. Concentrations measured in picograms per milliliter can cause measurable effects. This is a bit frightening when you realize that each of us is carrying around many grams (that's trillions of picograms) of LPS in our normal gut flora. Too much LPS and you die of sepsis, even if no live bacteria are present. Your immune system will kill you. For this reason, LPS has been referred to as bacterial endotoxin, though recent findings suggest it is much more than a mere toxin.

One very intriguing theory has been presented by John Marshall in a paper in Clinical Infectious Diseases (2005). He suggested that LPS should be thought of primarily not as a toxin, but as a hormone. It bears many similarities to our more familiar hormones. It exerts systemic effects by binding to specific receptors in multiple target tissues, triggering gene expression. It's effects are tightly regulated by a specific binding protein (creatively named "LPS binding protein") and multiple negative feedback loops. Typical of other hormones, it is harmful in excess, but beneficial in the right quantity and the right context. Of course it is quite odd for a hormone to be produced outside of your body, but in other respects it might fit the mold.

LPS typically spikes after meals, and has an acute systemic inflammatory effect. Going back to the mouse study, Caricilli et. al. found that their TLR2 knockout mice had higher serum LPS levels than the controls, and a greater increase in serum LPS following oral ingestion. The higher spike in LPS could be explained by the fact that the TLR2 knockout mice had lower levels of a tight junction protein that helps maintain gut barrier integrity. So it looks like an altered immune system resulted in an altered microbiome which changed intestinal barrier integrity which increased exposure to an exogenous hormone resulting in systemic inflammation, which caused metabolic dysfunction insulin resistance and obesity. Or, since the paper did not clearly establish cause and effect, any of the foregoing in any other causal permutation. Ok!

There is a lot more to say about LPS. What sorts of things cause it to increase, chronically or acutely? What regulates the body's response to it? And what about those curious negative feedback loops? More importantly, can we observe its effects through self-experimentation? Stay tuned for more.

Follow Up on Butter

Welcome readers. I wanted to post some follow up details on my experiments so far and say a bit more about the themes I will be writing more about. You'll notice that my headlines so far have been phrased as questions. This is not an homage to a popular quiz show -- they are questions because I don't know the answers. So with that in mind I wanted to revisit the results of my first experiment (Is Butter as Powerful as a Statin?).

Science is hard, and if you attempt it, you need to stay vigilant about not fooling yourself, because, as Richard Feynman has said, you're the easiest person to fool. So I'll be reviewing my initial results to see whether I've fooled myself. Of course when it comes to personal science, we should always be aware of this principle in reviewing work done by others. If someone has managed to fool himself (even for a moment), perhaps they might fool you too. I hope my readers will keep this in mind.

Commenter EricT highlighted the biggest weakness in my butter experiment.  I originally added the butter to my diet to see what sorts of subjective effects it might have (they were positive, but I did not track anything quantitative that I can present). I tracked my lipids at the time only in order to monitor whether they might move in an adverse direction. It looked like the Kerrygold butter caused beneficial changes while other brands did not. I therefore changed my hypothesis mid-stream, which is a substantial source of bias, effectively rendering my statistical analysis invalid (this particular weakness is not applicable to the second experiment on safe starches vs. HDL, though of course other weaknesses do apply). Meanwhile I am continuing the butter experiment and will present all additional data points in a couple of weeks so we can see whether the effect holds. In the mean time, by then I will have data from another VAP cholesterol test so I can have more confidence about what my CardioChek meter is actually measuring and how consistent it is. Stay tuned for that.  Meanwhile I have declared a "grain of salt" advisory on the butter post.

If the additional data points do not show a continuation of the effect seen previously, it would weigh strongly against the hypothesis that butter causes beneficial changes in lipids (though this is somewhat independent to the question of whether butter is good or bad from a cardiovascular perspective). Many alternative hypotheses could explain a negative outcome -- the effect could have been the result of the bias, a short-lived disruption of homeostasis, a systematic user error or environmental sensitivity with the CardioChek device, or an unknown and temporary cause coinciding in time with the applicable data points. Since I did not decide beforehand how long my experiment would last, the effect could also have been a statistical anomaly which only seemed "significant" because of the particular day on which I decided to compile my results (that is, you can't just wait until you get the result you want and choose that as the date on which to terminate your study).

In the mean time, I've been measuring another health marker that is related to gut health and the microbiome.  I am going to write about about that and then present some interesting and hopefully useful data over the next few weeks.

Sunday, April 1, 2012

Do Carbs Lower HDL?

Attack of the Safe Starches


If you have been lurking around paleoland recently you will have heard the debate about safe starches (you may be sick of hearing about it in fact).  Last fall I ran an experiment to find out whether it might be a good idea to dip my toe into the safe starch swimming pool. I was tracking my lipids around this time with the CardioChek PA so I could have some idea of what was going on with my metabolism.  Here are the results.

I first experimented with a low carbohydrate diet in 2009 after reading Good Calories, Bad Calories by Gary Taubes. I lost 15 pounds in the first three months (though I had no idea I was carrying any extra fat).  I gained muscle without changing my exercise program.  My seasonal allergies went away.  My teeth got whiter, less sensitive and stopped collecting plaque.  I got fewer sunburns.  My joints stopped aching after exercise.  You get the idea.

Around this time I took an oral glucose tolerance test and found my numbers to be a bit high, though not in the pre-diabetic range just yet. I tend to get a high initial blood sugar spike, though the value quickly returns to normal. I thought this (along with the other general health improvements I experienced) was an indicator that a low carb diet was a good approach for me. I bought a cheap glucometer to play with and stuck with the low carb program.

Over the years my diet progressed to a paleo approach, while I continued to avoid starches. On most days I ate only eggs, meat, fish, some nuts and a good helping of green veggies. Given the safe starches controversy, I thought it would be interesting to try adding 100g or so of carbs per day in the form of sweet potatoes, just to see what would happen. There is a variety of chatter about the possibility that low carbohydrate diets can raise LDL, so I thought I might see a drop in non-HDL cholesterol with a bit of added starches. I did get a drop, but it wasn't to the non-HDL.

Results


Mean non-HDL did not change during the experiment (193 to 203, not statistically significant), but mean HDL dropped by a significant amount (67 to 57, p<0.001). I stopped the experiment after one month. You'll see in the plot below that the HDL went back up to the previous level after the daily sweet potato was dropped.
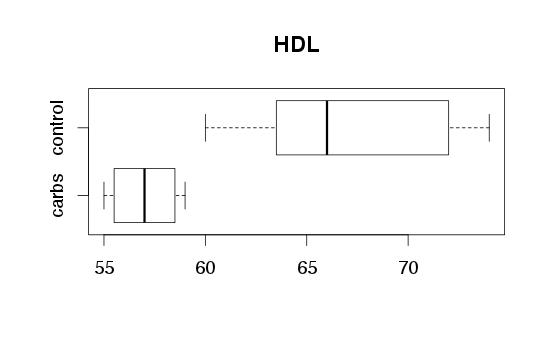
Boxplots show minimum, maximum and quintiles. Mean HDL: 67 (control), 57 (carbs).
The trendline is a linear model based on all low carb data points (before and after, but not including, the carb intervention).
Trendline based on all low-carb points.  Non-HDL cholesterol was not significantly affected.

Details of the Experiment

The data points were collected as previously discussed in the butter experiment. Data does not include any points during the butter experiment, as there was a significant change in HDL and non-HDL during that time. Statistical significance test is based on a linear model, calculated by ANOVA using R.

Sweet potatoes were eaten slowly so as not to spike blood sugar above 120, though spikes may have occurred on occasion. It usually takes me about an hour to eat one, though I can eat them very fast without a spike if I've recently completed a heavy workout.

There are a number of limitations to the interpretation of this data that are worth mentioning. Perhaps most significantly, this is a very short term test (1 month). It is possible that long term adaptations would have reversed the effects seen here. Second, there was only a single intervention period, which could have corresponded to another unknown variable which caused HDL to decrease. Since foods differ in micronutrient, mineral and toxin content, it is not possible to generalize from sweet potatoes to all carbohydrates.  I may have had a different result with white rice, white potatoes, taro, tapioca, etc.  Finally, of course this result applies to me only. There may be others who have a much higher carbohydrate tolerance, or who may even see the opposite result.

Is This Actionable Information?


So why am I bothering with this? First of all, simple curiosity. I have the ability to collect data that most people do not collect, and there is some interesting science concerning these molecules and what they may be able to tell me about my metabolism.

Does the decrease in HDL identified here represent an unhealthy change? Perhaps. Though HDL is commonly referred to as the "good cholesterol", I would not suggest that all decreases in HDL are unhealthy.  In fact I don't know how one would go about establishing the truth or falsehood of a statement like that. Conversely, we know of chemicals that raise HDL while simultaneously causing heart attacks.  My HDL was never "low" during the course of this experiment. However, together with certain other data I was also collecting at this time (which is a story for another day), I believe that 100 grams of starch per day is too much for me. At least in my current metabolic state, with my current lifestyle, exercise habits, sleep, stress level, etc.

Some smaller amount of starch is most likely "safe," and may be a good idea. These days I often eat a banana (about 20-30 grams of sugar+starch) after lunch, and I have not seen the negative effects caused in me by higher amounts of carbohydrate. As mentioned, I also have found that I can eat 100 grams of carbs immediately after a heavy workout with no significant change in my blood sugar (e.g. it might increase from 65 to 83 in response to a pound of sweet potatoes after two hours of powerlifting). These days, workouts like that occur about once a week (sometimes less), and I have not noticed any negative effects from eating carbs this infrequently.  Since many smart (and strong) people advocate carbs post-workout, I am willing to go along for now, at least while I do not have any contradictory evidence.

Published Research


Perhaps if I had looked this stuff up in the scientific literature first I would have been less surprised by my results. It turns out there is plenty of published research supporting the idea that carbs lower HDL. However, it is a bit surprising that the relationship continues even below 100g/day. I doubt there is published research on this relevant to long-term low carbers, so three cheers for personal science on that front. A study by a German team, published in January 2012 in the Annals of Nutrition and Metabolism, does a good job summing up the research that is out there.  Here is their conclusion regarding carbohydrates and HDL:

"There is convincing evidence that a higher carbohydrate proportion in the diet at the expense of total fat or saturated fatty acids intake lowers the plasma concentration of HDL cholesterol."

The paper is called "Evidence-Based Guideline of the German Nutrition Society: Carbohydrate Intake and Prevention of Nutrition-Related Disease." It is worth a read if you are interested and still awake. If instead you are sleeping (and not German), perhaps you are dreaming of a world in which the nutrition organizations in your country also use evidence as the basis for their guidelines.

Wednesday, March 28, 2012

Is Butter As Powerful as a Statin?

Notice: A Grain of Salt Advisory is in effect for this post. See comments and this new post for details. Subsequent data collection has changed the conclusions presented below.
Butter is an interesting food. For those who have graduated from an un-scientific fear of fat, it would seem to encapsulate almost everything that is good about cow's milk, with only small amounts of the questionable stuff (lactose and milk proteins). What's not to like? Certainly some very sensitive people could respond negatively to the trace sugars and proteins in butter, but for most people it seems like it should qualify as a health food.

Health professionals are usually quick to warn us away from butter because it is high in artery-clogging-saturated-fat. The old story goes that butter is bad for you because saturated fat raises cholesterol, and elevated cholesterol causes heart disease. I can't do an n=1 experiment on the effects of butter on mortality but with a home cholesterol meter it is easy to find out whether the first part of the old story is true. Does butter actually raise blood cholesterol levels? Whether that has anything to do with heart disease is a story for another day (I happen to believe there may be a small relationship between cholesterol and heart disease for some people, but it's complicated).

In fact, eating half a stick of butter a day significantly lowered my cholesterol. It lowered it about as much as the reported effects of many statins (sorry, haven't tried the statins so you'll have to trust the clinical trials on those). Read on for the details, but first a few words about butter.

What color is it?


These days, most consumers expect butter to be white and margarine to be a pleasing yellow. Never mind the fact that margarine was originally colored yellow in order to make it look like healthy grass-fed butter. For years, many states had laws prohibiting the sale of artificially colored margarine. Housewives were sometimes sold a small packet of food coloring with each tub so they could trick their families into thinking they were eating something that was good for them.

Butter with a high vitamin content is yellow, not white. Unfortunately, artificially colored butter is also yellow. In fact, butter and cheese were the first foods the U.S. federal government allowed to be artificially colored. This gave butter producers a leg up in competing against margarine, where artificial colors were usually not allowed. For most foods, added colors need to be identified on the label and/or ingredients list. Butter is exempt from this requirement (see Section 101.22(k)(3) of Title 21 of the U.S. Code of Federal Regulations).  Therefore, do not judge American butter by its color.

The best butter is made from milk produced by cows that live outside and eat their natural diet, grass. The "organic" label can be applied to corn-fed cows raised in feedlots. Therefore, the term doesn't really tell you anything useful about the quality of butter. It is about as useful as calling farmed fish "organic." Personally I don't pay any attention to that label when it comes to butter and I look for butter that I am confident comes from cows that live outside and eat only grass.

Butter throughout History


Anthimus, an exiled Byzantine doctor writing in northern Gaul in the 6th century, recommended butter with honey to patients suffering from tuberculosis. This is interesting because, for many years prior to the introduction of antibiotics, cod liver oil (which, like grass fed butter, is rich in vitamin A) was the standard of care for tuberculosis treatment.

The dentist Weston A. Price found butter to be a staple food in many healthy populations around the world.

According to MS Iceland Dairies, which produces the Smjor brand of butter, the Icelandic people prized butter as an important and healthy food.
"People usually had considerable stores of butter; it was used extensively, and it was considered a source of strength during the harsh winter months when people needed to consume a lot of fat. The recommended portion was approximately 1700g a week per person."
For the Americans in the audience: 1700 grams of butter is over 3.7 pounds. Per week.

Butter seems to be especially valued in cold climates, perhaps because it could be stored prior to refrigeration without going too far rancid. For example, see Tibet and their famous rancid yak butter tea.

Cholesterol for Breakfast


As I mentioned above, I don't believe there is a strong relationship between blood cholesterol levels and heart disease risk. In addition, if there is a relationship between blood cholesterol levels and total mortality, it appears to be non-linear and probably U-shaped, with increased mortality when levels are too high or too low. That said, my cholesterol has been a bit higher than I'd like over the last 10 years or so, and I've tried on and off to see if there is a reasonable way to change it without doing something crazy like eating laxatives or plant hormones. Over the past year I've been monitoring my blood lipids from time to time with a CardioChek meter and paying attention to what causes the numbers to change. Most of the data for this experiment comes from the CardioChek machine, though some readings are lab tests ordered by my doctor.

Notwithstanding the absence of supporting evidence, the 2010 Dietary Guidelines for Americans recommend that humans consume no more than 300 mg of cholesterol per day. Now a few times in the past two years I have substantially varied my egg intake, and therefore my total dietary cholesterol. Although I don't have enough readings to get good statistics on these changes, my observation is consistent with the published scientific literature. There is no association between dietary cholesterol, per se, and my blood cholesterol. My cholesterol generally stays the same or perhaps drops a little when I eat more eggs (e.g. going from no egg consumption to 4 per day). There may be some subset of the population that is sensitive to dietary cholesterol, but I do not seem to fall into that category.

The Thousand Calorie Omelete


This story is not about eggs or dietary cholesterol. It is about what happened to me when I added a large amount of butter to my breakfast. In January I added half a stick of butter (about 57 grams) to my morning omelete. I first got this idea from Seth Roberts, who reportedly has been eating half a stick of butter per day for some time in order to increase his mental performance.  Seth believes butter has been good for his heart. Dave Asprey also recommends eating lots of butter for brain health, among other reasons. My omelete consists of four pastured eggs, half a stick of Kerrygold Irish butter, and three tablespoons of coconut oil. Thats 1,076 calories, 110 grams of fat (75 grams from saturated fat) and 865mg of cholesterol. My diet otherwise stayed the same, though I was usually eating smaller portions of everything else.

The effect this had on my blood cholesterol was significant enough to inspire me to finally start a blog. Of all the interventions I've tried over the years, this has been by far the most powerful and the first one to show up clearly after the first couple of data points.

Here are the results. On average: HDL is up 19%, non-HDL is down 25%. Both results are statistically significant with high confidence levels, despite relatively small sample sizes (p<.001 and .01 respectively). Here are some boxplots to make it more convincing. The plots show min, max, mean, and the 1st and 3rd quintiles.

Boxplots showing min, max, mean and quartiles.
Mean HDL (control, treatment, change): 65, 77, +19%.
Mean non-HDL (control, treatment, change): 196, 148, -25%

The following plots show my pre-butter trends for HDL and non-HDL in red, with the post-butter readings in blue (thanks Seth for the suggestion).  This suggests that the new readings do not reflect the continuation of a pre-existing trend.  I did not add trendlines for the post-butter readings because there are not enough datapoints for them to make sense.  Note that 5 of the 6 post-butter HDL readings are the highest ever recorded.  4 of the 6 non-HDL readings are the lowest ever recorded.


What's the Best Butter?


When I was growing up, I was quite a picky eater, and was very specific about the brands of butter that I would allow my parents to bring into the house.  Most brands tasted downright rancid.  Even still, I don't think I ever tasted good butter until I was well into my adult years.  The bad stuf is not worth eating, and I now have a bit of experimental evidence to back that up.


My butter of choice is Kerrygold from Ireland. While Kerrygold seems to be somewhat coy about saying "100% grass fed" in its marketing materials, it is pretty consistently cited as the best butter that is readily available around the U.S.  Trader Joe's almost always has the best prices in my vicinity.  During the course of this experiment, I tried two other types of butter.  One was Smjor, mentioned above.  The other was a "grass fed" butter from my local farmers' market.  The Smjor was delicious and very yellow, so it looked like a good pick.  The local butter was white and not especially appetizing, perhaps understandable for cows living in New York in the winter and necessarily given some kind of supplemental feed.  The cholesterol readings I was getting from the Smjor and local butter were all over the map and were not consistent with the numbers I got with the Kerrygold.  Therefore I did what any good scientist would have done and threw those data points away so I could present results only for thousand calorie omeletes made with Kerrygold.


Details of the Experiment


There are 6 measurements in the experimental (butter) group and 16 in the control (non-butter) group. Additional measurements taken within 1 week were not used. The butter group includes all measurements made when I had been eating at least 1/2 stick (about 56 grams) of Kerrygold butter per day for at least a week prior to measurement. Datapoints when I was consuming other brands of butter were not included. The first five measurements were VAP cholesterol tests ordered by my doctor.  Otherwise, I measured total cholesterol and HDL cholesterol in a single panel with a CardioChek PA. I did not measure LDL directly, and I did not calculate it because my fasting triglycerides are not measurable with my meter (<50). Besides, the LDL calculation formulas are nonsense at best when triglycerides are under 100. I use non-HDL as a rough estimate of the atherogenic potential of blood lipids (basically a crude proxy for apolipoprotein B).

The increase in HDL and decrease in non-HDL were both statistically significant as determined by ANOVA using R (p<.001 and .01 respectively). However, I should point out that, for a variety of reasons, these are not high quality statistics. First of all, I have no formal training in statistics. Given that some data points were taken fairly close together in time, there is likely some serial correlation between measurements. I also made no particular effort to control for other variables. Finally, these results apply to me. There may well be people who respond differently and for whom butter is unhealthy. As with anything, it is always advisable to test things for yourself. So take this with a grain of salt. Or half a stick of butter, if you prefer.