Today's topic is something that is seldom discussed when health and diet topics come up. I started working on this post about a year ago, but first wanted to work through some other ideas that I thought were important for understanding what is going on. It was hard to write and could be even harder to understand. This post covers topics from computational biology to lipopolysaccharide and the microbiome. Basically a little bit of everything (for my present definition of "everything"). The main topic is the usefulness of measuring one's triglycerides after meals. But first a little digression on measuring things, and on measuring blood sugar in particular.
Measuring Things
Once something can be measured it becomes a target for tracking and manipulation. Conversely, things that cannot be easily measured are often overlooked. As a result it is easy to place undue importance on measurable quantities at the expense of those that are more difficult to observe.
Gary Taubes mentions this idea in reference to cholesterol in Chapter 1 of Good Calories, Bad Calories. He writes: "what kept the cholesterol hypothesis particularly viable through the prewar years was that any physician could measure cholesterol levels in human subjects." Once discovered to be easily measurable, cholesterol became a target for management, and interventions that seemed to affect cholesterol levels were suddenly of great interest in the treatment of heart disease, regardless of any known or hypothesized relationship between those interventions and heart disease itself. Total cholesterol got managed because it was routinely measured. Later, other biomarkers were identified and studied in turn, such as HDL and fasting triglycerides. More recently, measurement of specific lipoproteins and particle density subfractions has come into vogue.
Blood Sugar
While fasting biomarkers are interesting, a lot of the action occurs in the postprandial ("after eating") state. Your doctor probably does not do any postprandial measurements unless you are pregnant or a suspected diabetic, in which case an oral glucose tolerance test may be indicated. In the low-carb and paleo worlds, the effect of a carbohydrate-containing meal on blood sugar is well known. Many folks on the curious/nerdy spectrum even own their own glucometers and test themselves from time to time after meals.
Knowing a bit about your postprandial blood sugar response seems like a good idea. There is plenty of evidence that high blood sugars are a problem (see review papers here and here). Jenny Ruhl over at Blood Sugar 101 has written extensively about this.
How does blood sugar go wrong? Tolstoy said that happy families are all alike, but that each unhappy family is unhappy in its own way. Perhaps the same may be said for carbohydrate metabolism. While young healthy people seem to be able to regulate blood sugar within a narrow range at all times, including after meals, people in various stages of metabolic derangement exhibit different patterns of abnormal blood sugars. Sometimes they spike too high but quickly return to normal. In others, they may rise gradually and hang out at excessive levels. Other people have so-called "reactive hypoglycemia", where a high-carbohydrate meal triggers an abnormally low blood sugar a few hours later.
As the patterns of metabolic disturbance differ, we should expect that there are many different underlying causes, including a variety of disease states, short term and chronic injuries, toxin exposures, and genetic polymorphisms. A metabolic maze of twisty passages, all different. Once started, a pattern of high blood sugar could be a problem in itself, with blood sugar reaching levels toxic to organs, nerves, and other tissues.
 |
| A model of disease mediated by glucose disregulation. |
So I put postprandial blood sugar in the category of biomarkers that are easy to measure, and therefore more likely to be managed by many health conscious folks.
Many factors can affect postprandial blood sugar. These could include your glycogen status, fasted vs. fed state, proximity to exercise (e.g. post-exercise glucose uptake), rate of gastric emptying, the size and composition of the meal, carbohydrate content of the baseline diet, how fast you eat and how good your are at chewing, sleep deprivation, stress, and glycemic index.
Lipopolysaccharide exposure can also cause insulin resistance and raise postprandial blood sugar. The microbiome is involved in its own complex manner, as we saw with the TLR-2 knockout mice. Even ambient temperature may have an effect. Finally, the behavior of pancreatic beta cells is known to be quite complex and non-linear, so the blood sugar response to a particular meal may be difficult to predict.
The Elephant in the Room
Carbohydrate (primarily glucose) is not the only circulating energy substrate. It is one of four main categories, the others being fat (usually packaged in triglyceride form and carried by lipoproteins), amino acids (which can be glucogenic or ketogenic), and ketones. A few other molecules such as lactate and pyruvate can also serve as circulating energy substrates.
When you eat a lower carbohydrate diet, your fat intake necessarily goes up, and when you eat fat, that fat is absorbed and enters circulation in triglyceride form. So at some point I began to wonder whether eating a higher fat diet was spiking my triglycerides at the same time as it was normalizing my blood sugar. While it is well known that fasting triglycerides go down on a low carb/high fat diet (see e.g. Volek and Westman 2002), it was not clear to me what happens to triglycerides after a high-fat meal.
Some Fat Diabetic Rats
The figures below come from a study on diabetic rats (Motojima et al 2008). I like it because it shows the substitution of high postprandial blood sugar on a standard high carbohydrate rat diet for high postprandial triglycerides on a high fat diet. (Note also that NEFA (non-esterified fatty acids) in the lower right chart does basically the same thing that triglycerides do. We'll come back to those in a bit.) Also note that the peak in triglycerides comes a bit later than the peak in blood sugar. This is likely due to the fact that fatty acids absorb more slowly than carbohydrates. That said, the pattern is pretty much the same between fats and carbs: after a meal, circulating energy substrates peak and then go back down.
 |
| Postprandial values for standard (solid circles) and high fat (open squares) diets in Goto-Kakizaki diabetic obese rats. They had to train the rats to eat their chow during a one-hour window, twice a day, because rats would ordinarily not do that. From Motojima et al 2008. |
One last item to note in these charts is what happens on the right hand side, long after the meal has been digested. Note that the high fat diet causes a long term elevation of not only triglycerides and NEFA, but also of insulin, compared to the standard chow. In fact, it even looks like the triglycerides creep higher from the 12:00 to the 15:00 readings. For now, let's arbitrarily label this extended post-meal phenomenon "inflammation."
We know by the way that the high fat diets used in these sorts of studies cause metabolic problems in rats, which is why they are used as a model of obesity. We should not therefore assume, as many wrongly do, that high fat diets are also unhealthy for humans. However, we can look at this sort of animal research as a guide to what happens when a diet does induce metabolic problems in humans (elevated fasting triglycerides would be an example of that kind of diet).
So while it is normal for circulating energy in the form of blood sugar and triglycerides to go up after meals, if it goes up too much or for too long you end up in a sort of metabolic gasoline fight. Like elevated blood sugar, elevated postprandial triglycerides is associated with heart disease and stroke and a host of other bad consequences. See, e.g. a recent review ("Triglycerides and Heart Disease, Still a Hypothesis?", Goldberg et. al. 2011). A scientific statement by the American Heart Association cites a pile of research related to this topic as well.
Diabetes is a metabolic disregulation that causes excess postprandial blood sugar. It also causes excess postprandial triglycerides. For details on how this works, you can consult this review article (Tushuizen et. al. 2004). On the other hand, a metabolically healthy person should be able to eat reasonable amounts of a wide range of macronutrient combinations without adverse postprandial effects.
Diabetes is a metabolic disregulation that causes excess postprandial blood sugar. It also causes excess postprandial triglycerides. For details on how this works, you can consult this review article (Tushuizen et. al. 2004). On the other hand, a metabolically healthy person should be able to eat reasonable amounts of a wide range of macronutrient combinations without adverse postprandial effects.
 |
| Expanded model: a variety of bad things can disrupt one or more regulatory systems, resulting in postprandial abnormalities in glucose and/or fat metabolism. |
How do Carbohydrates Affect Triglycerides?
You may have heard in low carb diet circles that it is actually carbohydrate, and not fat, that makes triglycerides go up. This is both true, misleading, and false. Let me explain.
What is almost certainly true is that a high carbohydrate diet can cause fasting triglycerides to go up. This is widely understood to be the case, and was noted by the German dieticians in the guidelines I linked to in my writeup on carbohydrates and HDL. In fact, HDL and triglyceride levels are tightly interconnected, and it seems to be the case that most things that raise HDL will also lower triglycerides. This probably has something to do with the action of cholesterylester transfer protein, but my head hurts every time I try to figure it out.
What about postprandial triglycerides? Well, ingestion of a sufficient amount of fat causes an acute rise in triglycerides, generally peaking between 2 and 6 hours. This fact is very well known in the medical community and has been known for a very long time. See e.g. this description of an oral fat tolerance test given to dogs by Arthur Knudson 1917. He fed fat to dogs and then watched the fat in their blood go up as they digested it. The protocol they used was also commonly used on humans and is remarkably similar to the methods used in modern studies investigating the same phenomena.
Absorption of fat is also associated with an acute phase inflammatory response. Lipopolysaccharide ("LPS") is involved, as discovered by Clett Erridge et. al. in 2007 ("A high fat meal induces low-grade endotoxemia: evidence of a novel mechanism of postprandial inflammation"). Postprandial increases in triglycerides have been found to be correlated with LPS in obese subjects (see Clemente-Postigo 2012). So the question is not whether fat consumption raises triglycerides. The question is how high does it raise them and how long does it raise them for?
A study from Jeff Volek's lab (Sharman et. al. 2004) showed that consumption of a very low carbohydrate diet can significantly reduce postprandial triglycerides in response to a high fat test meal. The study used two six-week dietary interventions (low carb and low fat) in a crossover design. The low carbohydrate diet contained approximately 10% carbohydrate. Analysis based on diet records confirmed that the participants were eating only 36 grams of carbohydrate per day on average. So in contrast to many other low carbohydrate diet studies, this one really used a low carbohydrate diet, for a sufficient duration to allow the initial phases of fat adaptation to take place.
Note that both diets were hypocaloric. As these were overweight individuals, we might expect metabolic health to improve on any reasonably dietary intervention of this duration that is low in calories.
At baseline and after the end of each six week intervention period, each participant was given an oral fat tolerance test consisting of a standardized high-fat test meal (the same idea as what Arthur Knudson did to his dogs in 1917). Serum triglycerides were measured hourly following the test and the results are shown below.
 |
| Triglycerides after high-fat test meal. Sharman et. al. 2004. |
The first thing to note is that these were metabolically unhealthy individuals. The dotted curve shows the baseline result after the subjects had been consuming their normal diets. Note that the peak occurs at 4 hours and is very high (multiply mmol/L by 88.5 to get mg/dL, the peak looks to be approximately 290 mg/dL).
Second, note that both diets improved matters significantly compared to baseline in these overweight men. Both diets reduced fasting triglycerides (the "pre" point), and the low carbohydrate diet reduced them more as you would expect. The low carbohydrate group also has a much greater improvement in postprandial numbers, both in the height of the peak (it looks to be about 185 mg/dL), but also in its earlier time of occurrence. The total "area under the curve" is of course much lower in the low carbohydrate group compared to the low fat group or the baseline diet. The long tail of elevated triglycerides in the baseline and low fat groups is reminiscent of what I arbitrarily decided to call "inflammation" when we saw it in the obese diabetic rats. For the time being lets call it "inflammation" here too.
Now take a look at the points at 6-hour mark. This is where a person might typically be starting their next meal. If triglycerides are still high here from the last meal, the next meal will pile on top and drive them even higher. The triglyceride level for the low fat group at 6 hours is about where the peak triglycerides were in the low carb group at hour 3. The triglycerides for the low carb group on the other hand have dropped to about where they were when the low fat dieters were in the fasted state. A second high-fat meal at this stage would be much worse for the low fat dieters than for the low carb dieters.
Of course, typically the low fat dieters would not be having a fatty meal, they'd be having a crunchy carby meal. And that brings up a sensible criticism of this work. You might naturally expect the low carb group to better tolerate a high-fat meal because of their higher baseline fat consumption, in the same way that low carb-adapted folks may not do to well in a glucose tolerance test unless they are given the opportunity to adapt to carbohydrates over a couple of days beforehand. There is probably an element of truth to this. However I would point out that a metabolically healthy individual should be able to undergo a typical oral fat tolerance test while showing results similar to what the low carb group shows here. It looks to me as if the low carb intervention resulted in a substantial correction of a metabolic abnormality.
In addition, my experience testing my own triglycerides over the past year suggests that even adding a relatively small amount of carbohydrate to a high fat diet is enough to worsen postprandial triglycerides. At least this seems to be the case for me, and it would be very interesting to see if there is any research on this phenomenon. I would think the threshold would probably vary from one person to another, in the same way that people who successfully lose weight on low carbohydrate diets may have different threshold levels of carbohydrate consumption before things start to go pear shaped.
So What About That Pesky Lipopolysaccharide?
As mentioned, Clett Erridge et. al. showed that fat consumption permits lipopolysaccharide to enter the body through the gut, thereby inducing low-grade inflammation. It's a neat paper that looks at the problem from multiple angles -- worth a skim if you have time.
 |
| Lipopolysaccharide's infamous lipid A. |
One might criticize Erridge's experiment by pointing out that the "high fat meal" consisted of a cup of tea and three slices of buttered toast. It was indeed high in fat, but you could argue, if you had PaleoTM inclinations, that it is actually the gluten in the bread and not the fat causing the gut barrier dysfunction. Gluten -> Leaky Gut -> LPS = Bad.
I would point out that Erridge's experiment was carried out in the United Kingdom, and it may have been considered unacceptably rude, or even against IRB requirements, to recruit subjects for a multi-hour ordeal without offering them a nice up of tea and a buttered toast sandwich. Anyway, subsequent work (see Deopurkar et. al. 2010) found the same effect after ingestion of dairy cream alone. I would like to see more replications of this result with different fats, but I won't hold my breath until someone tries it with a Paleo ApprovedTM wild caught grass fed organic fat source. Part of the trouble is that lipopolysaccharide is maddeningly difficult to measure, coming as it does in picogram quantities and having a potential circulating half-life measured in a few minutes.
The 2004 Sharman paper from Jeff Volek's lab (in addition to my own experiences) strongly suggests that LPS is not going to be a problem on a decent high fat diet. In that study, we saw the profound anti-inflammatory effects of a few weeks of fat adaptation. I suspect that, when and if the experiment is done, researchers will discover that fat adaptation either blunts the absorption of LPS, speeds its clearance from circulation, or attenuates the body's inflammatory response to it. We won't know for sure until they do the study, so lets hope at least that someone is working on it.
What About Those Pesky NEFAs?
Evelyn has written extensively at CarbSane about the potentially toxic effects of non-esterified fatty acids, which increase in circulation in the postprandial state. I don't know much about those, and I will be doing some more reading to get up to speed. As we saw with the fat diabetic rat study, it may be the case that NEFAs move in concert with triglycerides, so we can measure them by proxy. In other words, it may be the case that NEFAs come out of adipose tissue at the same time, and for the same reason, as the liver is producing excess VLDL particles. I will be on the look out for studies that suggest otherwise. For the time being, I'm not going to hold my breath until someone publishes (in an open-access journal) the exact NEFA study I'd like to see.
Some Personal Observations
So the CardioChek meter I have can measure triglycerides. Ordinarily this feature would be used in the fasted state as part of a standard three chemistry lipid panel (with total cholesterol, HDL and fasted triglycerides). However, nobody will stop you from using the triglyceride strips after meals (I won't tell). So I ordered a box last fall to play around with. The strips showed up a week into my sweet potato experiment, which I talked about previously in "Do Carbs Lower HDL?". I was still learning how best to use them (e.g. how long after a meal I should test), but I got some interesting results. I was surprised in a couple of instances to see numbers in excess of 200 mg/dl, for example after having a rib eye steak, a salad and a cup of nuts for dinner. These days, on a lower carbohydrate diet, I seldom see a peak reading over 150 despite some rather high fat meals. For example, readings 2.5 hours after a 1,000 calorie omelette usually range from 130 to 150 but can be much lower the day after heavy exercise. Readings at 3.5 hours are almost always lower than the 2.5 hour reading, indicating that the peak occurs before that time (the omelette contains 110 grams of fat, 75 grams of which are saturated, which is higher than the amounts used in the fat tolerance tests we've looked at).
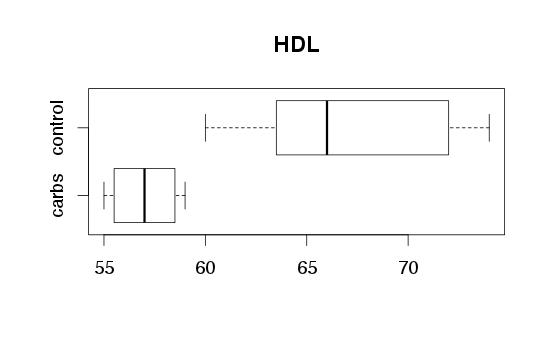
My postprandial triglycerides were generally higher during my one month "safe starch" experiment, which is entirely consistent with the significant drop in HDL that I experienced during that time. I don't measure that frequently, but my maximum triglyceride level these days usually stays under 155.
A Digression on Modeling
I've written a little bit about the idea that we can better understand complex systems by building models, and then playing around with the models to see how they behave. Of course, models are no good if they don't reflect reality. On the other hand, a good model can be not only a useful clinical tool (see e.g. the minimal model of insulin), but can also help bring about important discoveries (e.g. the dominance of the kidney fluid mechanism of blood pressure control using the Guyton molel).
So I decided to construct a simple model to see if it could help me understand the triglyceride readings I've been seeing. The model is described by the diagram below. It is the simplest thing I could come up with.
 |
| A simple model of triglyceride absorption and clearance. |
The model has two compartments: the gut and the systemic circulation. The rest of the tissues in the body take up lipids from circulation, but are modeled as an infinite sink and are not separately modeled. Ingested lipids are absorbed from the gut into circulation, and then cleared from circulation into the tissues. The purpose of the model is to understand what the dynamics of that process may look like.
The initial conditions are determined by the amount of lipids ingested. This quantity (L) decreases as lipids are absorbed, at a rate equal to a constant (p) representing the permeability of the gut, multiplied by the amount of lipids remaining. Mathematically, the gut compartment is described by a simple first order differential equation, dL/dt = -pL.
Circulating lipids, represented by the variable C, increase when lipids are absorbed and decrease when they are cleared. The absorption term is the same as that for the gut compartment (pL) with the sign reversed. Intuitively, this means that every bit of lipid that leaves the gut immediately enters the circulation. The clearance of lipids from circulation is modeled by a term similar to the term describing absorption in the gut compartment. Lipids are cleared from circulation in proportion to the amount remaining in circulation, multiplied by a clearance factor (c). There is no accommodation for the metabolic state or storage capacity of the adipose or other tissues of the body. Mathematically, this gives us another first order differential equation, this time with two terms: dC/dt = pL - cC. In this model, the amount of fasting lipids is normalized to zero. In real life there will be a constant offset to the measured value of C.
The goal is to understand how the amount of circulating lipids changes over time. This could give some guidance in interpreting triglyceride readings taken at different times after a test meal. The model is very simple so far and does not yet take into account the mysterious elevations in triglycerides that I have so far been arbitrarily calling "inflammation." So let's look at it for now as a picture of the postprandial triglyceride curve for an idealized perfect human that has no inflammation.
 | ||
| Triglycerides vs. time in response to a single ingested bolus, based on a simplified model. |
I will not delve deeply here into the mathematics behind the model. Suffice it to say that after solving the two differential equations and making a biologically plausible simplification, you get a curve of the form C=axe-bx+k. The model has three degrees of freedom, corresponding roughly to the height and width of the curve, plus a constant factor which can be calibrated to the fasting triglyceride measurement. This equation can now be taken into a statistical computing environment and tested against real data.
A Test of Three Foods
Here is a little bit of the data I have collected so far. The chart below shows the results of a series of test meals each containing a single food: avocados, macadamia nuts, and coconut oil (which was emulsified in warm water). In each case the meals were standardized to 75g of fat based on tables from the USDA nutrient database. Each food is predominantly fat, but the fatty acid profiles are quite different. Each food was consumed in its whole form along with its usual vitamins, minerals and other micronutrients.
The tests were conducted on successive Saturday afternoons in the fasted state, during the same month when I was doing the safe starches experiment and eating 100g of extra carbs from sweet potatoes per day. The fatty acid profiles of these three test meals are very different, as was their digestibility (particularly so in the case of the coconut oil).
The three foods had very different effects on my postprandial triglycerides, with avocados being the worst and coconut oil being the best. Of course the coconut oil would have produced a great deal of circulating ketones, which I did not measure. I believe the numbers below are roughly consistent with research I have seen comparing the effects different fatty acids. In addition, the data suggests that, as you might expect, the macadamia nuts were digesting slowest of all three fats.
The points in the graph below are the actual measurements and the curves show the best-fit solutions to my simplified triglyceride dynamics model. The curves were fitted in R using nonlinear least squares. The fits are not perfect of course, as the model is oversimplified at present and there will always be measurement error to contend with. In the next section I will discuss a possible enhancement to the model.
 |
| Triglyceride values and fitted curves based on the idealized computational model. Green: avocado; red: macadamia nuts; brown: coconut oil. Each meal was eaten at time=0 on successive Saturday afternoons in the fasted state. Each meal standardized to 75g fat. |
Using the Model: Idealized Response Plus Inflammation?
I took a look at the data from the Sharman paper in light of my simplified model. Since the very low carbohydrate group in the Sharman study showed the lowest fasting and peak triglycerides, as well as the fastest clearance, we can assume they suffered the lowest chronic and postprandial inflammation. Therefore it is expected that the shape of the curve for the very low carbohydrate group would most closely approximate the ideal shape predicted by the simplified model. This is indeed the case in this data set.
As mentioned above, my presumption is that the idealized model will most closely reflect the dynamics of lipid absorption in a perfectly healthy, non-inflammatory state. Differences between actual data readings and the model predictions could be used to gauge the extent of both chronic and acute/postprandial inflammation. These results can be obtained with this data set by fitting the curve predicted by the model to the data points obtained from the low carbohydrate group. In this case, only the points along the rising left hand slope were used for the fit, in order to prevent the fitted curve from overshooting.
The graph below on the left shows the actual data from Sharman et. al. in red (baseline), green (low fat) and blue (low carb). The black line is the fitted model prediction. The graph on the right shows the differences between the actual readings for each series and the predictions of the model fitted to the low carbohydrate points.
The offset at time t=0 represents elevated fasting triglycerides, a chronic abnormality, while the differences in area under the curve, after adjusting for the baseline difference at t=0, could reflect different postprandial inflammatory responses.
 |
| Time on x axis in hours (test meal at t=1). Blue=very low carbohydrate, green=low fat, red=baseline, black=model fitted to very low carbohydrate using nonlinear least squares (nls()). Left chart shows original triglyceride measurements and model. Right chart shows original data points in each series minus model fit to the very low carbohydrate data points. Model was optimized for fit to points at t=1, 2 and 9 hours. Data from Sharman et. al. 2004. |
The Sharman data are interesting because the three series, though quite different in appearance, were taken in the same individuals in a balanced crossover study design, and using the same standardized challenge meal. We don't need to calibrate the curves to account for changes in body size, genetics or any other factor. The only variable is the metabolic state of the individual resulting from the dietary intervention. This is why it makes sense to compare all three curves to the model prediction as fit only to the low carbohydrate data points.
We see that all three curves reflect an increase in "area under the curve" as compared to the idealized model. One hypothesis is that the low fat and baseline curves are higher because of blunted absorption of fat. However, when fiddling with the idealized model, it becomes apparent that blunted absorption would result in a more skewed triglyceride curve, instead of the more symmetrical ones observed here in connection metabolic disturbance. Therefore the model suggests this hypothesis is not correct. (Note for math nerds: the approximate model solution presented in this post has only three degrees of freedom and does not exhibit this skewing behavior. You need to work with the full solution with all four degrees of freedom to see it.)
The liver increases production of VLDL particles after meals (see e.g. Timlin and Parks 2005), contributing to the postprandial rise in triglycerides. This production is further increased in response to inflammation (e.g. exposure to LPS -- check out this awesome paper by Barcia and Harris to see why that might be happening). Now take a look at the chart on the right hand side above. Note that the curves are all approximately the same shape, but differ in height. Note that they all peak around t=5 (four hours after the meal), just as Timlin and Parks say they should if they reflect hepatic VLDL production. So basically that's why I think it's inflammation.
Based on the above, the constant term in the idealized model can be used to represent chronic inflammation. As before this would be calibrated to fasting triglycerides, with the caveat that they would need to be truly fasted numbers (i.e. 8-10 hour fasts may not be sufficient in individuals who present extended post-meal inflammation). In addition, a term can be added to reflect the release of VLDL triggered by the acute inflammatory response caused by test meal.
Concluding Remarks
Mainstream recommendations are that fasting triglycerides should stay below 150. Now I'm not sure a truly metabolically healthy individual will have fasting triglycerides of 150, but as a postprandial number, it seems to be a reasonable target. Based on the evidence presented above, I think a more significant factor may turn out to be the existence of an inflammatory tail, which would show up in the 4+ hour postprandial readings. However, at least as compared to blood sugar, the epidemiological evidence is quite thin, so it is hard to recommend any particular thresholds of concern.
From browsing around the scientific literature and my own experience with the test strips, there appear to be a variety of things that can cause elevated postprandial triglycerides. Here are a few:
- Fed vs fasted state (calorie excess or deficit)
- Exercise (beyond the effect caused by energy depletion)
- Type of fat in the meal
- Type of fat in baseline diet (particularly, lack of omega-3 fats)
- Baseline carbohydrate consumption
- Lipopolysaccharide and inflammation in general
Funny, this looks sort of like the list I laid out earlier for the factors affecting blood sugar.
A 2010 article ("Dietary cholesterol and egg yolks: Not for patients at risk of vascular disease") makes the case that eggs are a bad idea because their cholesterol content will lead to elevated postprandial triglycerides. That hasn't been my experience, but it would be pretty straightforward to test it. A test of two meals, calibrated for total fat and calories, with a non-cholesterol containing fat substituting for egg yolks in the control meal.
A variety of lines of evidence suggest that the polyphenols in olive oil could inhibit postprandial inflammation. The experiment here would be to compare the triglyceride response to extra light olive oil vs. a very spicy unfiltered extra virgin. The fatty acid content should be similar but the oils would differ greatly in polyphenol content.
It has been suggested that oxidative stress mediates these phenomena. A high dose of vitamin c or e, or a glutathione precursor (e.g. whey protein) may show an effect when consumed near the meal. It would be interesting to see how the triglyceride readings vary based on the timing of the antioxidant dose relative to the meal.
Overall I think triglycerides are a good target for self-experimentation. They seem to provide quick insight into metabolism and inflammation that is hard to get any other way. Experiments can be done quickly instead of waiting months for fasting lipoproteins to reach homeostasis. That said, there is some inconsistency in readings, suggesting significant measurement error and perhaps a hypersensitivity to your state of health, making single readings quite difficult to interpret. Likewise, readings taken far apart in time can be very difficult to compare.
In the mean time, it is interesting to see what kinds of insights we can get by building simple models of ourselves in our computers. If you'd like to try it yourself, take a look at CellML, an open standard for storing and sharing computational models. A free software implementation called OpenCell is available for Linux, Windows and Mac OS.